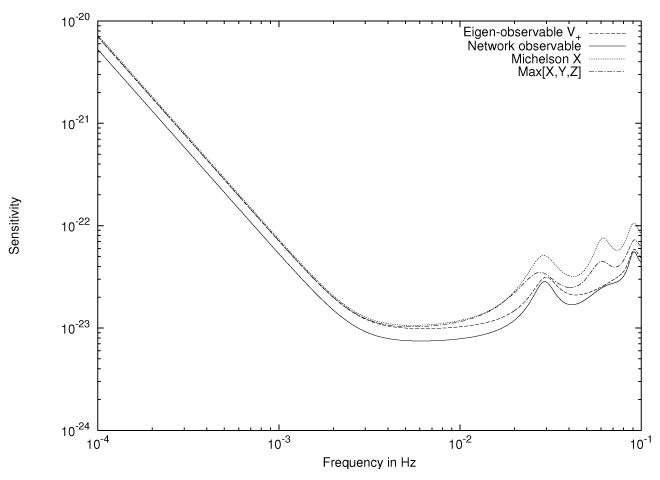
Figure 11: Sensitivity curves for the observables: Michelson, ![max [X, Y,Z ]](article876x.gif) ,
,  , and network for
the source direction (
, and network for
the source direction ( ,
,  ).
).
, , and network for
the source direction (, ).Massimo Tinto and Sanjeev V. Dhurandhar, "Time-Delay Interferometry",
Living Rev. Relativity, 17 (2014), 6, doi:10.12942/lrr-2014-6, URL (accessed <date>): http://www.livingreviews.org/lrr-2014-6. This work is licensed under a Creative Commons License.
© The author(s), except where otherwise noted.
This work is licensed under a Creative Commons License.
© The author(s), except where otherwise noted.
Living Rev. Relativity, 17 (2014), 6, doi:10.12942/lrr-2014-6, URL (accessed <date>): http://www.livingreviews.org/lrr-2014-6.
This work is licensed under a Creative Commons License.
© The author(s), except where otherwise noted.