
List of Figures
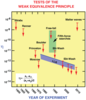 |
Figure 1:
Selected tests of the weak equivalence principle, showing bounds on  , which measures
fractional difference in acceleration of different materials or bodies. The free-fall and Eöt-Wash
experiments were originally performed to search for a fifth force (green region, representing many
experiments). The blue band shows evolving bounds on , which measures
fractional difference in acceleration of different materials or bodies. The free-fall and Eöt-Wash
experiments were originally performed to search for a fifth force (green region, representing many
experiments). The blue band shows evolving bounds on  for gravitating bodies from lunar laser
ranging (LLR). for gravitating bodies from lunar laser
ranging (LLR). |
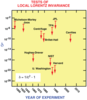 |
Figure 2:
Selected tests of local Lorentz invariance showing the bounds on the parameter  , which
measures the degree of violation of Lorentz invariance in electromagnetism. The Michelson–Morley,
Joos, Brillet–Hall and cavity experiments test the isotropy of the round-trip speed of light. The
centrifuge, two-photon absorption (TPA) and JPL experiments test the isotropy of light speed using
one-way propagation. The most precise experiments test isotropy of atomic energy levels. The limits
assume a speed of Earth of , which
measures the degree of violation of Lorentz invariance in electromagnetism. The Michelson–Morley,
Joos, Brillet–Hall and cavity experiments test the isotropy of the round-trip speed of light. The
centrifuge, two-photon absorption (TPA) and JPL experiments test the isotropy of light speed using
one-way propagation. The most precise experiments test isotropy of atomic energy levels. The limits
assume a speed of Earth of  relative to the mean rest frame of the universe. relative to the mean rest frame of the universe. |
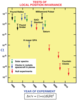 |
Figure 3:
Selected tests of local position invariance via gravitational redshift experiments, showing bounds on  , which measures degree of deviation of redshift from the formula , which measures degree of deviation of redshift from the formula  .
In null redshift experiments, the bound is on the difference in .
In null redshift experiments, the bound is on the difference in  between different kinds of clocks. between different kinds of clocks. |
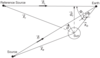 |
Figure 4:
Geometry of light deflection measurements. |
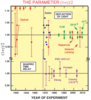 |
Figure 5:
Measurements of the coefficient  from light deflection and time delay
measurements. Its GR value is unity. The arrows at the top denote anomalously large values from
early eclipse expeditions. The Shapiro time-delay measurements using the Cassini spacecraft yielded
an agreement with GR to from light deflection and time delay
measurements. Its GR value is unity. The arrows at the top denote anomalously large values from
early eclipse expeditions. The Shapiro time-delay measurements using the Cassini spacecraft yielded
an agreement with GR to  percent, and VLBI light deflection measurements have reached
0.01 percent. Hipparcos denotes the optical astrometry satellite, which reached 0.1 percent. percent, and VLBI light deflection measurements have reached
0.01 percent. Hipparcos denotes the optical astrometry satellite, which reached 0.1 percent. |
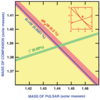 |
Figure 6:
Constraints on masses of the pulsar and its companion from data on B1913+16, assuming GR to be valid. The width of each strip in the plane reflects observational accuracy, shown as a percentage. An inset shows the three constraints on the full mass plane; the intersection region (a) has been magnified 400 times for the full figure. |
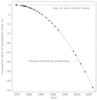 |
Figure 7:
Plot of the cumulative shift of the periastron time from 1975 – 2005. The points are data, the curve is the GR prediction. The gap during the middle 1990s was caused by a closure of Arecibo for upgrading. Image reproduced with permission from [409], copyright by AAS. |
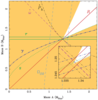 |
Figure 8:
Constraints on masses of the pulsar and its companion from data on J0737–3039A,B, assuming GR to be valid. The inset shows the intersection region magnified by a factor of 80. Image courtesy of M. Kramer. |
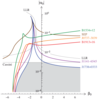 |
Figure 9:
Bounds on the scalar–tensor parameters  and and  from solar-system and binary
pulsar measurements. Bounds from tests of the Nordtvedt effect using lunar laser ranging and circular
pulsar–white-dwarf binary systems are denoted LLR and SEP, respectively. Image reproduced with
permission from [164], copyright by the authors. from solar-system and binary
pulsar measurements. Bounds from tests of the Nordtvedt effect using lunar laser ranging and circular
pulsar–white-dwarf binary systems are denoted LLR and SEP, respectively. Image reproduced with
permission from [164], copyright by the authors. |
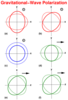 |
Figure 10:
The six polarization modes for gravitational waves permitted in any metric theory of gravity. Shown is the displacement that each mode induces on a ring of test particles. The wave propagates in the  direction. There is no displacement out of the plane of the picture. In (a),
(b), and (c), the wave propagates out of the plane; in (d), (e), and (f), the wave propagates in the
plane. In GR, only (a) and (b) are present; in massless scalar–tensor gravity, (c) may also be present. direction. There is no displacement out of the plane of the picture. In (a),
(b), and (c), the wave propagates out of the plane; in (d), (e), and (f), the wave propagates in the
plane. In GR, only (a) and (b) are present; in massless scalar–tensor gravity, (c) may also be present. |
Clifford M. Will, "The Confrontation between General Relativity and
Experiment",
Living Rev. Relativity, 17 (2014), 4, doi:10.12942/lrr-2014-4, URL (accessed <date>): http://www.livingreviews.org/lrr-2014-4. This work is licensed under a Creative Commons License.
© The author(s), except where otherwise noted.
This work is licensed under a Creative Commons License.
© The author(s), except where otherwise noted.
Living Rev. Relativity, 17 (2014), 4, doi:10.12942/lrr-2014-4, URL (accessed <date>): http://www.livingreviews.org/lrr-2014-4.
This work is licensed under a Creative Commons License.
© The author(s), except where otherwise noted.