4 Observing Scenario
In this section we estimate the sensitivity, possible number of detections, and localization capability for each of the observing runs laid out in Section 2.2. We discuss each future observing run in turn and also summarize the results in Table 1. In the following, we estimate the expected number of BNS coalescence detections using both the lower
and upper estimates on the BNS source rate density,  –
–  [13*]. Given the detectors’
noise spectral densities, the
[13*]. Given the detectors’
noise spectral densities, the  detection threshold can be converted into the (source sky-location and
orientation averaged) BNS sensitive detection range
detection threshold can be converted into the (source sky-location and
orientation averaged) BNS sensitive detection range  [13*, 20]. From this, the BNS source rate
density can be converted into an estimate of the number of expected detected events; this estimate carries
the large error on the source rate density. Similar estimates may be made for NS–BH binaries
using the fact that the NS–BH range is approximately a factor of
[13*, 20]. From this, the BNS source rate
density can be converted into an estimate of the number of expected detected events; this estimate carries
the large error on the source rate density. Similar estimates may be made for NS–BH binaries
using the fact that the NS–BH range is approximately a factor of  larger than the BNS
range,5
though the uncertainty in the NS–BH source rate density is slightly larger [13*]. We assume a nominal
larger than the BNS
range,5
though the uncertainty in the NS–BH source rate density is slightly larger [13*]. We assume a nominal  threshold of 12, at which the expected FAR is
  . However, such a stringent threshold may not be
appropriate for selecting candidate triggers for electromagnetic follow-up. For example, selecting CBC
candidates at thresholds corresponding to a higher background rate of
. However, such a stringent threshold may not be
appropriate for selecting candidate triggers for electromagnetic follow-up. For example, selecting CBC
candidates at thresholds corresponding to a higher background rate of  (
( ) would increase
the number of true signals subject to electromagnetic follow-up by about 30% (90%). The area localization
for these low-threshold signals is only fractionally worse than for the high-threshold population – by
approximately 20% (60%). The localization of NS–BH signals is expected to be similar to that of BNS
signals.
) would increase
the number of true signals subject to electromagnetic follow-up by about 30% (90%). The area localization
for these low-threshold signals is only fractionally worse than for the high-threshold population – by
approximately 20% (60%). The localization of NS–BH signals is expected to be similar to that of BNS
signals.
For typical burst sources, the GW waveform is not well known. However, the performance of burst
searches is largely independent of the detailed waveform morphology [14, 51*], allowing us to quote an
approximate sensitive range determined by the total energy  emitted in GWs, the central frequency
 of the burst, the detector noise spectrum
  , and the single-detector SNR threshold
  [101],
![[ G E ]1∕2 Rburst ≃ ---2-3-----GW2--2-- . (2 ) 2π c S(f0)f0ρ det](article87x.gif)
 and
and  ;
;  is an
optimistic value for GW emission from stellar collapse (see, e.g., [18]), the uncertainty in
is an
optimistic value for GW emission from stellar collapse (see, e.g., [18]), the uncertainty in  means
that the quoted burst ranges are more uncertain than their BNS counterparts. We use a single-detector
SNR threshold of 8, corresponding to a typical
means
that the quoted burst ranges are more uncertain than their BNS counterparts. We use a single-detector
SNR threshold of 8, corresponding to a typical  and FAR of
  . Due to the
tail of the low-frequency background-rate-vs-amplitude distribution in Figure 3*, we see that
varying the selection threshold from a background of
. Due to the
tail of the low-frequency background-rate-vs-amplitude distribution in Figure 3*, we see that
varying the selection threshold from a background of  (
( ) to even
  (
( ) would increase the number of true signals selected for electromagnetic follow-up by a
factor
) would increase the number of true signals selected for electromagnetic follow-up by a
factor  , though the area localization for low-SNR bursts may be particularly
challenging.
, though the area localization for low-SNR bursts may be particularly
challenging.
The run durations discussed below are in calendar time. Based on prior experience,
we can reasonably expect a duty cycle of  80% for each instrument during observing
runs.6
Assuming downtime periods are uncorrelated among detectors, this means that all detectors in a
three-detector network will be operating in coincidence approximately 50% of the time and two of the three
detectors will be operating an additional 40% of the time. For a four-detector network, three or more
detectors will be operational around 80% of the time. Our estimates for the expected number
of detections and the fraction of sources localized account for these duty cycles. The number
of detections also account for the uncertainty in the detector sensitive ranges as indicated in
Figure 1*.
80% for each instrument during observing
runs.6
Assuming downtime periods are uncorrelated among detectors, this means that all detectors in a
three-detector network will be operating in coincidence approximately 50% of the time and two of the three
detectors will be operating an additional 40% of the time. For a four-detector network, three or more
detectors will be operational around 80% of the time. Our estimates for the expected number
of detections and the fraction of sources localized account for these duty cycles. The number
of detections also account for the uncertainty in the detector sensitive ranges as indicated in
Figure 1*.
4.1 2015 – 2016 run (O1): aLIGO 40 – 80 Mpc
This is the first advanced-detector observing run, lasting four months, starting 18 September 2015 and ending 12 January 2016. The aLIGO sensitivity is expected to be similar to the early band in Figure 1*, with a BNS range of 40 – 80 Mpc, and a burst range of 40 – 60 Mpc for . Our
experience so far indicates that sensitivity will probably be at the better end of this span, with a BNS range
potentially in the interval 60 – 80 Mpc.
. Our
experience so far indicates that sensitivity will probably be at the better end of this span, with a BNS range
potentially in the interval 60 – 80 Mpc.
A four-month run gives a BNS search volume of  at the confident detection
threshold of
at the confident detection
threshold of  . The search volume is
  , where
  is the range and
  is
the observing time incorporating the effects of the detectors’ duty cycles. We therefore expect
0.0005 – 4 BNS detections. A BNS detection is likely only if the most optimistic astrophysical rates
hold.
is
the observing time incorporating the effects of the detectors’ duty cycles. We therefore expect
0.0005 – 4 BNS detections. A BNS detection is likely only if the most optimistic astrophysical rates
hold.
With the two-detector H1–L1 network any detected events are unlikely to be well localized. A full parameter-estimation
study using realistic detector noise and an astrophysically-motivated source catalog has been completed for
2015 – 2016 [31*].7
This used a noise curve in the middle of the early range shown in Figure 1* (the early curve specified in
[30*]). The distribution of results is shown in Figure 6*. It was found that using an SNR threshold of 12, the
median 90% credible region for BNS signals is  , and only 4% of events are expected to have
 smaller than
  ; the searched area
  is smaller than
  for 16% of events
and smaller than
for 16% of events
and smaller than  in 6%. If a FAR threshold of
  is used without the SNR cut,
these localizations change because of the inclusion of an additional population of events with
SNRs
is used without the SNR cut,
these localizations change because of the inclusion of an additional population of events with
SNRs  –
–  . The median
  is
is  and 3% have
  smaller than
 ;
;  is smaller than
  for 14% of events and smaller than
  for
4%.
for
4%.
Equivalent (but not directly comparable) results for bursts are found in [51*]. Specific results depend
upon the waveform morphology used, but the median searched area is  –
–  times larger than for
BNS signals; part of this difference is due to the burst study using a less-stringent FAR threshold of
times larger than for
BNS signals; part of this difference is due to the burst study using a less-stringent FAR threshold of
 . The distribution of searched areas for four waveform morphologies are shown in
Figure 7*.
. The distribution of searched areas for four waveform morphologies are shown in
Figure 7*.
Follow-up observations of a GW signal would be difficult, but not impossible. Localizations provided by another instrument, such as a gamma-ray burst telescope, could improve the possibility of locating an optical or a radio counterpart.
4.2 2016 – 2017 run (O2): aLIGO 80 – 120 Mpc, AdV 20 – 60 Mpc
This is envisioned to be a six-month run with three detectors. The aLIGO performance is expected to be similar to the mid band in Figure 1*, with a BNS range of 80 – 120 Mpc, and a burst range of 60 – 75 Mpc for . The AdV range may be similar to
the early band, approximately 20 – 60 Mpc for BNS and 20 – 40 Mpc for bursts. This gives a
BNS search volume of
. The AdV range may be similar to
the early band, approximately 20 – 60 Mpc for BNS and 20 – 40 Mpc for bursts. This gives a
BNS search volume of  –
– , and an expected number of 0.006 – 20 BNS
detections.
, and an expected number of 0.006 – 20 BNS
detections.
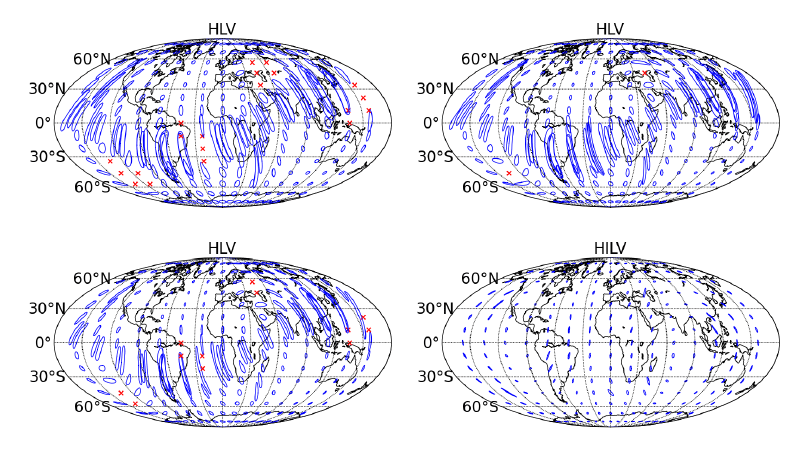
Source localization for various points in the sky for CBC signals for the three-detector network is sketched in Figure 8*.
BNS sky localization for 2016 – 2017 (in addition to 2015 – 2016) has been investigated in [99*]. This
assumed a noise curve which lies in the middle of the mid range in Figure 1* for aLIGO (the mid curve
specified in [30]) and the geometric mean of the upper and lower bounds of the mid region
in Figure 1* for AdV. The distribution of results is shown in Figure 6*. Performing parameter
estimation on an astrophysically-motivated BNS population, with an SNR threshold of 12 (in
addition to a FAR cut of  ), it was found that the median 90% credible region for
BNS signals is
), it was found that the median 90% credible region for
BNS signals is  , and 20% of events are expected to have
  smaller than
 . The searched area is smaller than
  for 44% of events and smaller than
 for 20%. The burst study [51*] gives approximately equivalent results, producing median
searched areas a factor of
for 20%. The burst study [51*] gives approximately equivalent results, producing median
searched areas a factor of  2 – 3 larger than the BNS results; these results are shown in
Figure 7*.
2 – 3 larger than the BNS results; these results are shown in
Figure 7*.
4.3 2017 – 2018 run (O3): aLIGO 120 – 170 Mpc, AdV 60 – 85 Mpc
This is envisioned to be a nine-month run with three detectors. The aLIGO and AdV sensitivities will be similar to the late and mid bands of Figure 1* respectively, with BNS ranges of 120 – 170 Mpc and 60 – 85 Mpc, and burst ranges of 75 – 90 Mpc and 40 – 50 Mpc for . This gives a BNS
search volume of
. This gives a BNS
search volume of  , and an expected 0.04 – 100 BNS detections. Source
localization for CBC signals is illustrated in Figure 8*. While the greater range compared to
the 2016 – 2017 run increases the expected number of detections, the detector bandwidths are
marginally smaller. This slightly degrades the localization capability for a source at a fixed
SNR.
, and an expected 0.04 – 100 BNS detections. Source
localization for CBC signals is illustrated in Figure 8*. While the greater range compared to
the 2016 – 2017 run increases the expected number of detections, the detector bandwidths are
marginally smaller. This slightly degrades the localization capability for a source at a fixed
SNR.
4.4 2019+ runs: aLIGO 200 Mpc, AdV 65 – 130 Mpc
At this point we anticipate extended runs with the detectors at or near design sensitivity. The aLIGO detectors are expected to have a sensitivity curve similar to the design curve of Figure 1*. AdV may be operating similarly to the late band, eventually reaching the design sensitivity circa 2021. This gives a per-year BNS search volume of , giving an expected 0.2 – 200 confident BNS
detections annually. Source localization for CBC signals is illustrated in Figure 8*. The fraction
of signals localized to areas of a few tens of square degrees is greatly increased compared to
previous runs. This is due to the much larger detector bandwidths, particularly for AdV; see
Figure 1*.
, giving an expected 0.2 – 200 confident BNS
detections annually. Source localization for CBC signals is illustrated in Figure 8*. The fraction
of signals localized to areas of a few tens of square degrees is greatly increased compared to
previous runs. This is due to the much larger detector bandwidths, particularly for AdV; see
Figure 1*.
4.5 2022+ runs: aLIGO (including India) 200 Mpc, AdV 130 Mpc
The four-site network incorporating LIGO-India at design sensitivity would have both improved sensitivity and better localization capabilities. The per-year BNS search volume increases to , giving an expected 0.4 – 400 BNS detections annually. Source localization is illustrated in
Figure 8*. The addition of a fourth detector site allows for good source localization over the whole
sky [96, 109, 79, 91].
, giving an expected 0.4 – 400 BNS detections annually. Source localization is illustrated in
Figure 8*. The addition of a fourth detector site allows for good source localization over the whole
sky [96, 109, 79, 91].
 in
gravitational waves at 150 Hz and scale as
in
gravitational waves at 150 Hz and scale as  , so it is greater for more energetic sources
(such as binary black holes). The binary neutron-star (BNS) localization is characterized by the
size of the 90% credible region (CR) and the searched area. For 2015 – 2016 and 2016 – 2017,
these have been calculated from parameter-estimation studies (neglecting detector calibration
uncertainty) [31*, 99*] using LALInference [110]. The CRs for subsequent periods are estimated
from timing triangulation (highlighted by italics), which is known to provide estimates on average a
factor of
, so it is greater for more energetic sources
(such as binary black holes). The binary neutron-star (BNS) localization is characterized by the
size of the 90% credible region (CR) and the searched area. For 2015 – 2016 and 2016 – 2017,
these have been calculated from parameter-estimation studies (neglecting detector calibration
uncertainty) [31*, 99*] using LALInference [110]. The CRs for subsequent periods are estimated
from timing triangulation (highlighted by italics), which is known to provide estimates on average a
factor of  4 too large for a three-detector network [60*, 31*], hence these serve as a conservative
bound. Both ranges as well as the BNS timing-triangulation localizations reflect the uncertainty in
the detector noise spectra shown in Figure 1*. Differences in the shape of the detector noise curves
and also relative sensitivities between detectors have an effect on the localization areas. The BNS
detection numbers also account for the uncertainty in the BNS source rate density [13]. BNS detection
numbers and localization estimates are computed assuming a signal-to-noise ratio greater than 12.
Burst localizations are expected to be broadly similar to those derived from timing triangulation,
but vary depending on the signal bandwidth; the median burst searched area (with a false alarm rate
of
4 too large for a three-detector network [60*, 31*], hence these serve as a conservative
bound. Both ranges as well as the BNS timing-triangulation localizations reflect the uncertainty in
the detector noise spectra shown in Figure 1*. Differences in the shape of the detector noise curves
and also relative sensitivities between detectors have an effect on the localization areas. The BNS
detection numbers also account for the uncertainty in the BNS source rate density [13]. BNS detection
numbers and localization estimates are computed assuming a signal-to-noise ratio greater than 12.
Burst localizations are expected to be broadly similar to those derived from timing triangulation,
but vary depending on the signal bandwidth; the median burst searched area (with a false alarm rate
of  ) may be a factor of
  2 – 3 larger than the values quoted for BNS signals [51]. No
burst detection numbers are given, since the source rates are currently unknown. Localization and
detection numbers assume an 80% duty cycle for each instrument.
2 – 3 larger than the values quoted for BNS signals [51]. No
burst detection numbers are given, since the source rates are currently unknown. Localization and
detection numbers assume an 80% duty cycle for each instrument.|
Epoch
|
2015 – 2016 | 2016 – 2017 | 2017 – 2018 | 2019+ | 2022+ (India) | ||
|
Estimated run duration
|
4 months | 6 months | 9 months | (per year) | (per year) | ||
|
Burst range/Mpc
|
LIGO | 40 – 60 | 60 – 75 | 75 – 90 | 105 | 105 | |
| Virgo | — | 20 – 40 | 40 – 50 | 40 – 80 | 80 | ||
|
BNS range/Mpc
|
LIGO | 40 – 80 | 80 – 120 | 120 – 170 | 200 | 200 | |
| Virgo | — | 20 – 60 | 60 – 85 | 65 – 115 | 130 | ||
|
Estimated BNS detections
|
0.0005 – 4 | 0.006 – 20 | 0.04 – 100 | 0.2 – 200 | 0.4 – 400 | ||
|
90% CR
|
% within
|
5 deg2 | < 1 | 2 | > 1–2 | > 3–8 | > 20 |
| 20 deg2 | < 1 | 14 | > 10 | > 8–30 | > 50 | ||
|
median/deg2
|
480 | 230 | — | — | — | ||
|
searched area
|
% within
|
5 deg2 | 6 | 20 | — | — | — |
| 20 deg2 | 16 | 44 | — | — | — | ||
|
median/deg2
|
88 | 29 | — | — | — | ||
 |
 |
 |