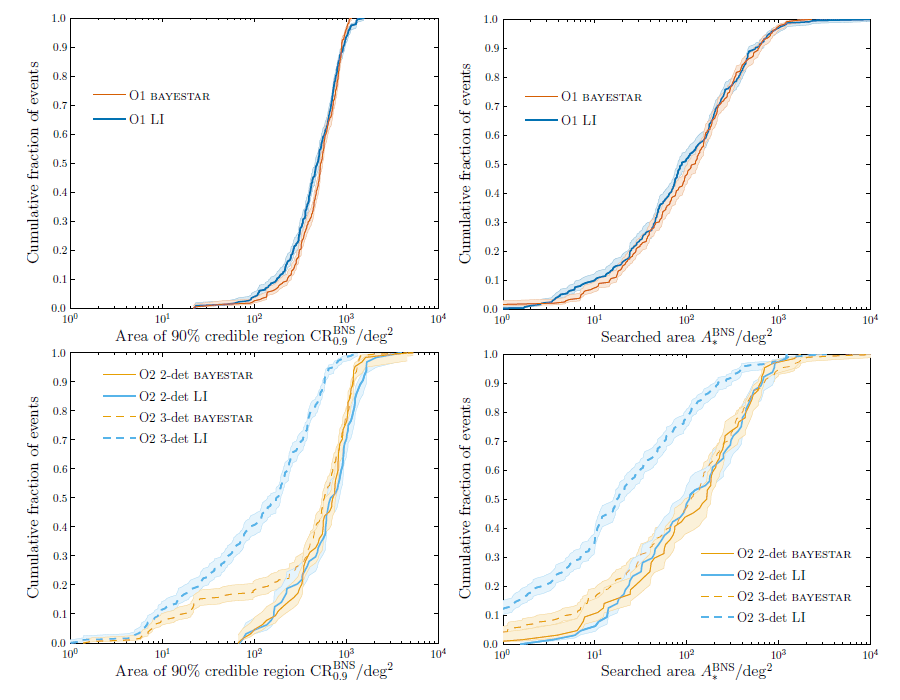
Figure 6: Anticipated binary neutron-star sky localization during the first two observing runs (top:
O1, see Section 4.1; bottom: O2, see Section 4.2). The plots show the cumulative fractions of events
with sky-localization areas smaller than the abscissa value. Left: Sky area of 90% credible region
 , the (smallest) area enclosing 90% of the total posterior probability. Right: Searched area
 , the area of the smallest credible region containing the true position. Results are shown
for the low-latency bayestar [98] and higher-latency (non-spinning) LALInference (LI) [110]
codes. The O2 results are divided into those where two detectors (2-det) are operating in coincidence,
and those where three detectors (3-det) are operating: assuming a duty cycle of
, the area of the smallest credible region containing the true position. Results are shown
for the low-latency bayestar [98] and higher-latency (non-spinning) LALInference (LI) [110]
codes. The O2 results are divided into those where two detectors (2-det) are operating in coincidence,
and those where three detectors (3-det) are operating: assuming a duty cycle of  80% for each
instrument, the two-detector network would be operating for
80% for each
instrument, the two-detector network would be operating for  40% of the total time and the
three-detector network
40% of the total time and the
three-detector network  50% of the time. The shaded areas indicate the 68% confidence intervals
on the cumulative distributions. A detection threshold of a signal-to-noise ratio of 12 is used and
results are taken from [31, 99].
50% of the time. The shaded areas indicate the 68% confidence intervals
on the cumulative distributions. A detection threshold of a signal-to-noise ratio of 12 is used and
results are taken from [31, 99].
, the (smallest) area enclosing 90% of the total posterior probability. Right: Searched area
, the area of the smallest credible region containing the true position. Results are shown
for the low-latency bayestar [98] and higher-latency (non-spinning) LALInference (LI) [110]
codes. The O2 results are divided into those where two detectors (2-det) are operating in coincidence,
and those where three detectors (3-det) are operating: assuming a duty cycle of 80% for each
instrument, the two-detector network would be operating for 40% of the total time and the
three-detector network 50% of the time. The shaded areas indicate the 68% confidence intervals
on the cumulative distributions. A detection threshold of a signal-to-noise ratio of 12 is used and
results are taken from [31, 99].