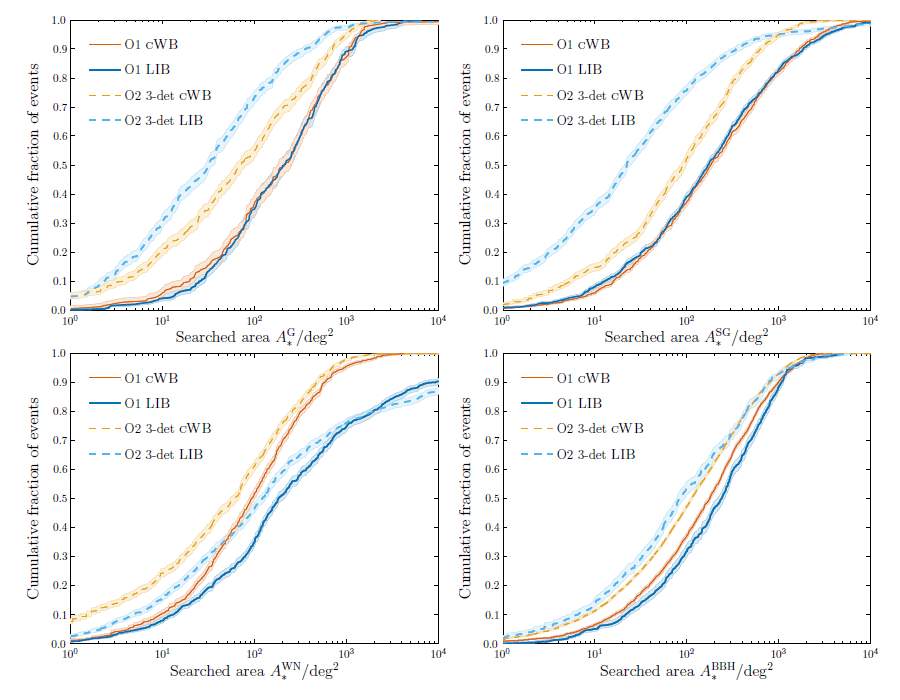
Figure 7: Simulated sky localization for Gaussian (G; top left), sine–Gaussian (SG; top right),
broadband white-noise (WN; bottom left) and binary black-hole (BBH; bottom right) bursts during
the first two observing runs (O1, see Section 4.1, and O2, see Section 4.2). The plots show the
cumulative fractions of events with searched areas  smaller than the abscissa value. Results
are shown for the low-latency coherent WaveBurst (cWB) [70, 71, 73] and higher-latency
LALInferenceBurst (LIB) [110] codes. The O2 results consider only a three-detector (3-det)
network; assuming an instrument duty cycle of
smaller than the abscissa value. Results
are shown for the low-latency coherent WaveBurst (cWB) [70, 71, 73] and higher-latency
LALInferenceBurst (LIB) [110] codes. The O2 results consider only a three-detector (3-det)
network; assuming an instrument duty cycle of  80%, this would be operational
  50% of
the time. The shaded areas indicate the 68% confidence intervals on the cumulative distributions.
A detection threshold of a false alarm rate of approximately
50% of
the time. The shaded areas indicate the 68% confidence intervals on the cumulative distributions.
A detection threshold of a false alarm rate of approximately  is used and results are taken
from [51].
is used and results are taken
from [51].
smaller than the abscissa value. Results
are shown for the low-latency coherent WaveBurst (cWB) [70, 71, 73] and higher-latency
LALInferenceBurst (LIB) [110] codes. The O2 results consider only a three-detector (3-det)
network; assuming an instrument duty cycle of 80%, this would be operational 50% of
the time. The shaded areas indicate the 68% confidence intervals on the cumulative distributions.
A detection threshold of a false alarm rate of approximately is used and results are taken
from [51].