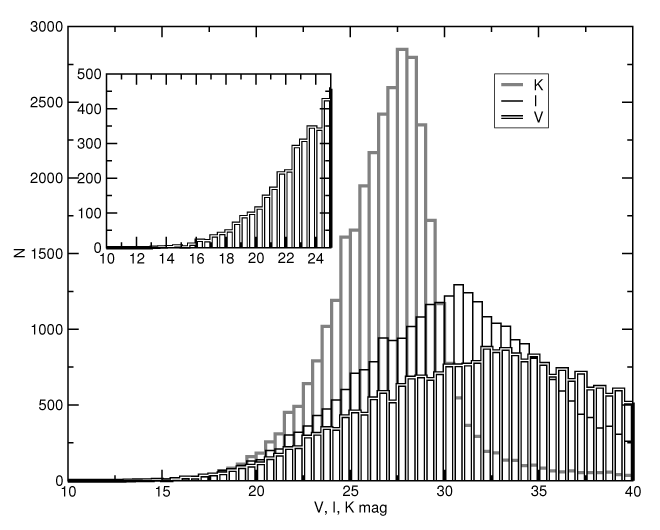
Figure 38: The histogram of apparent magnitudes of the WD binaries that are estimated to be
individually detected by LISA. The black-and-white line shows the distribution in the  -band, the
black line the distribution in the
-band, the
black line the distribution in the  -band and the grey histogram the distribution in the
  -band.
Galactic absorption is taken into account. The insert shows the bright-end tail of the
-band.
Galactic absorption is taken into account. The insert shows the bright-end tail of the  -band
distribution. Image reproduced with permission from [509], copyright by IOP.
-band
distribution. Image reproduced with permission from [509], copyright by IOP.
-band, the
black line the distribution in the -band and the grey histogram the distribution in the -band.
Galactic absorption is taken into account. The insert shows the bright-end tail of the -band
distribution. Image reproduced with permission from [509], copyright by IOP.Konstantin A. Postnov and Lev R. Yungelson, "The Evolution of Compact Binary Star Systems",
Living Rev. Relativity, 17 (2014), 3, doi:10.12942/lrr-2014-3, URL (accessed <date>): http://www.livingreviews.org/lrr-2014-3. This work is licensed under a Creative Commons License.
© The author(s), except where otherwise noted.
This work is licensed under a Creative Commons License.
© The author(s), except where otherwise noted.
Living Rev. Relativity, 17 (2014), 3, doi:10.12942/lrr-2014-3, URL (accessed <date>): http://www.livingreviews.org/lrr-2014-3.
This work is licensed under a Creative Commons License.
© The author(s), except where otherwise noted.