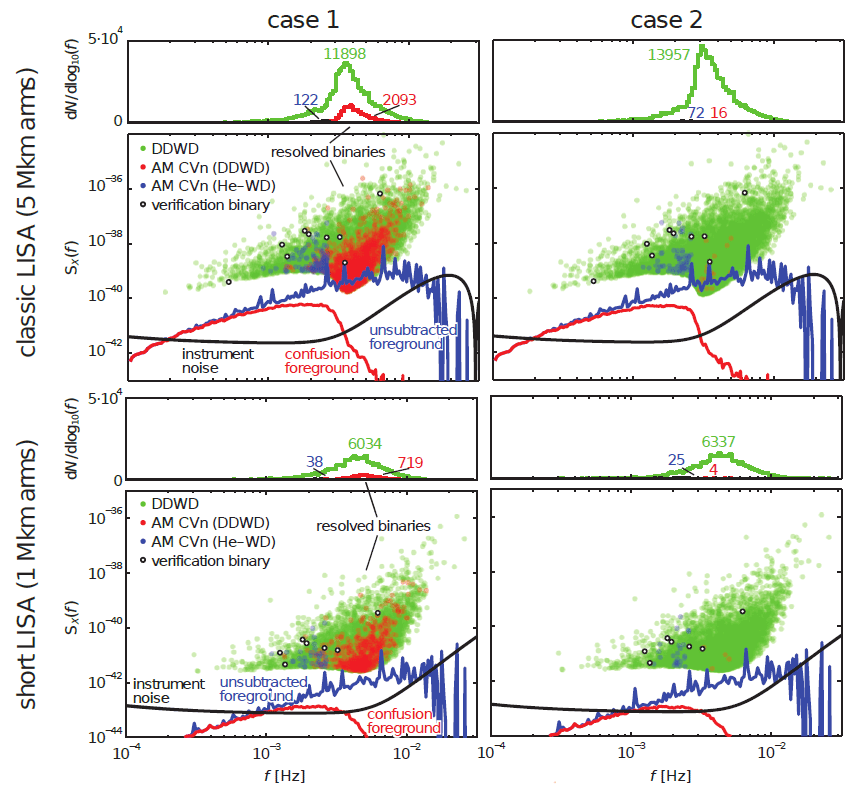
Figure 37: The frequency-space density and GW foreground of DD and AM CVn systems for two
scenarios. In each subplot, the bottom panel shows the power spectral density of the unsubtracted
(blue) and partially subtracted (red) foreground, compared to instrumental noise (black). The open
white circles indicate the frequency and amplitude of the “verification binaries”. The green dots show
the individually-detectable DD systems; the red dots show the detectable AM CVn systems formed
from DD progenitors and the blue dots show the detectable AM CVn systems that arise from the
He-star–WD channel. The top panel shows histograms of the detected sources in the frequency space.
Image reproduced with permission from [531], copyright by AAS.

