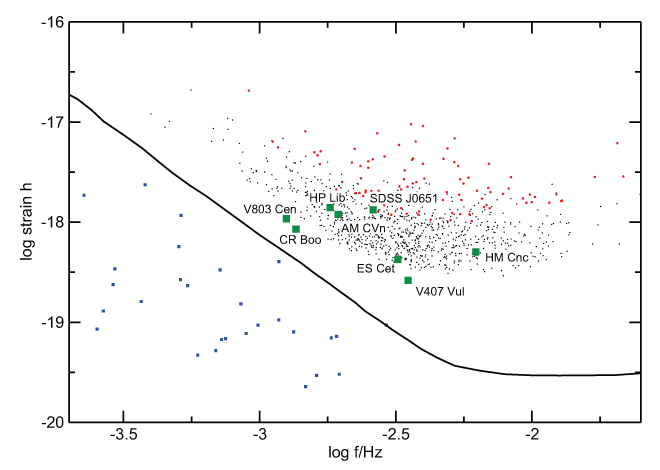
Figure 35: Strain amplitude spectral density (in Hz–1/2) versus frequency for the verification binaries
and the brightest binaries in the simulated Galactic population of ultra-compact binaries [519]. The
solid line shows the sensitivity of eLISA. The assumed integration time is 2 yrs. 100 simulated
binaries with the largest strain amplitude are shown as red squares. Observed ultra-compact binaries
are shown as blue squares, while the subsample of them that can serve as verification binaries is
marked as green squares. Image reproduced with permission from [11], copyright by the authors.

