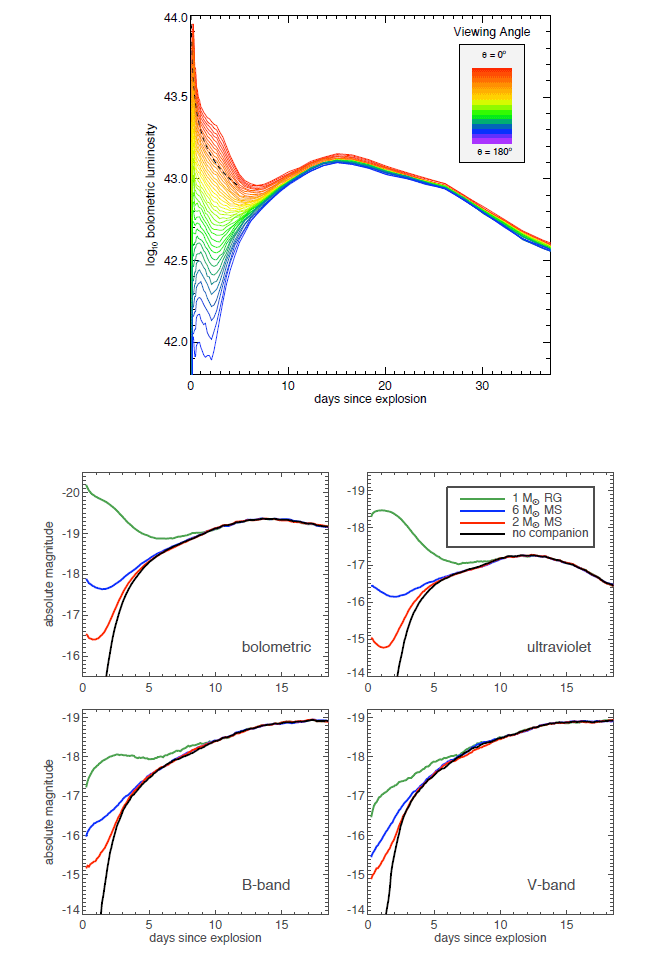
Figure 16: Upper panel: model light curve of a SN Ia having collided with a red giant companion
separated by  . The luminosity due to the collision is prominent at times
  days.
The black dashed line shows the analytic prediction for the early phase luminosity. Lower panel:
Signatures of interaction in the early broadband light curves of SN Ia for a red-giant companion at
 (green lines), a
  main-sequence companion at
  (blue lines), and
a
  main-sequence companion at
  (red lines). The ultraviolet light curves are
constructed by integrating the flux in the region 1000 – 3000 Å and converting to the AB magnitude
system. For all light curves shown, the viewing angle is 0. Image reproduced with permission
from [340], copyright by AAS.
 . The luminosity due to the collision is prominent at times
  days.
The black dashed line shows the analytic prediction for the early phase luminosity. Lower panel:
Signatures of interaction in the early broadband light curves of SN Ia for a red-giant companion at
 (green lines), a
  main-sequence companion at
  (blue lines), and
a
  main-sequence companion at
  (red lines). The ultraviolet light curves are
constructed by integrating the flux in the region 1000 – 3000 Å and converting to the AB magnitude
system. For all light curves shown, the viewing angle is 0. Image reproduced with permission
from [340], copyright by AAS.
