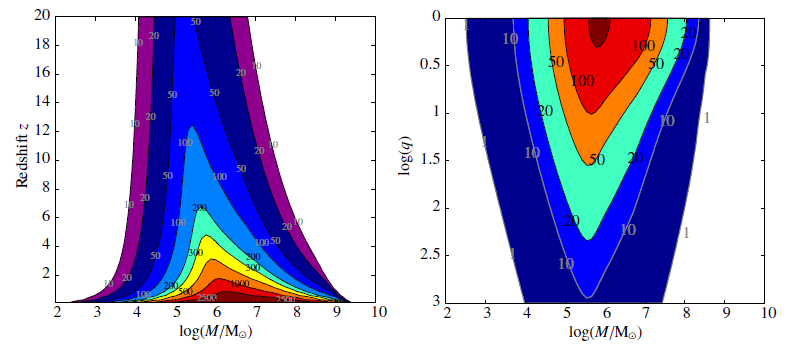
Figure 3: Contours of constant SNR for MBH binaries observed with eLISA. The left-hand panel
shows contours in the total-mass–redshift plane for equal-mass binaries, while the right-hand panel
shows contours in the total-mass–mass-ratio plane for sources at redshift  . Image reproduced
by permission from [21].
. Image reproduced
by permission from [21].
. Image reproduced
by permission from [21].Jonathan R. Gair and Michele Vallisneri and Shane L. Larson and John G. Baker, "Testing General Relativity with Low-Frequency, Space-Based
Gravitational-Wave Detectors",
Living Rev. Relativity, 16 (2013), 7, doi:10.12942/lrr-2013-7, URL (accessed <date>): http://www.livingreviews.org/lrr-2013-7. This work is licensed under a Creative Commons License.
© The author(s), except where otherwise noted.
This work is licensed under a Creative Commons License.
© The author(s), except where otherwise noted.
Living Rev. Relativity, 16 (2013), 7, doi:10.12942/lrr-2013-7, URL (accessed <date>): http://www.livingreviews.org/lrr-2013-7.
This work is licensed under a Creative Commons License.
© The author(s), except where otherwise noted.