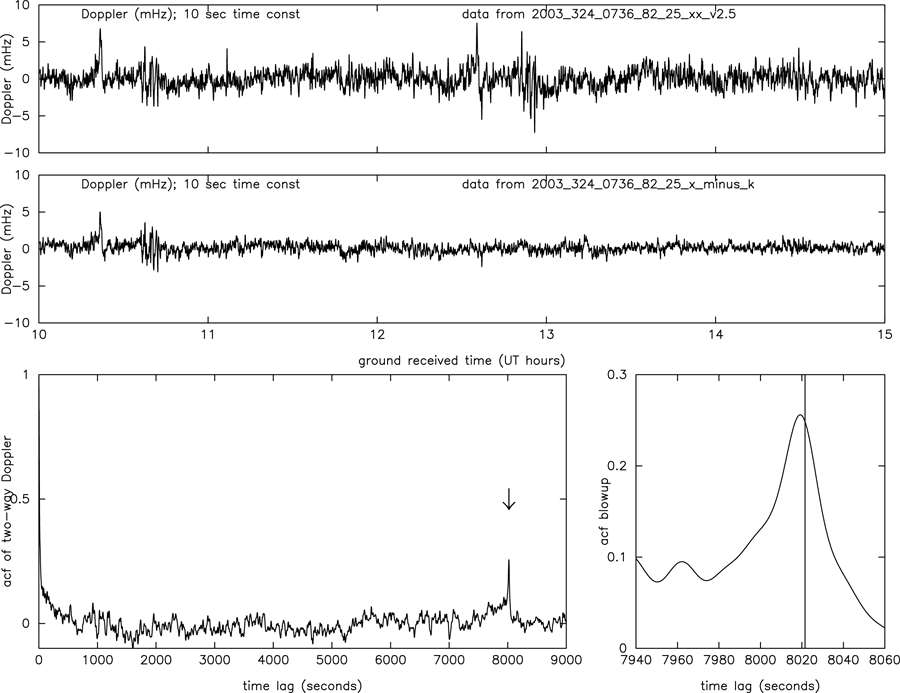
Figure 9: Doppler time series for DSS 25 Cassini track on 2003 DOY 324. Upper panel: time
series of the two-way X-band, showing two discrete events at about 10:20 and 10:40 ground received
time, echoed about a two way light time, T2, later. Middle panel: time series of X-(880/3344) Ka1,
which isolates the downlink plasma (and cancels nondispersive noises and signals: FTS, troposphere,
antenna mechanical noise, and GWs). This shows that the events observed in the upper panel are due
to plasma scintillation. Lower panel: acf of the two-way Doppler time series. The arrow marks the
two-way light time. The lower right panel is a blow-up of the acf near the two-way light time (indicated
by the vertical line). The acf peaks at lags slightly smaller than T2  8021.5 s, indicating that the
features observed in the upper panels are caused by near-earth plasma.AepubtkUpdateA2Modified
figure to discuss the blowup of the acf.
8021.5 s, indicating that the
features observed in the upper panels are caused by near-earth plasma.AepubtkUpdateA2Modified
figure to discuss the blowup of the acf.
8021.5 s, indicating that the
features observed in the upper panels are caused by near-earth plasma.AepubtkUpdateA2Modified
figure to discuss the blowup of the acf.