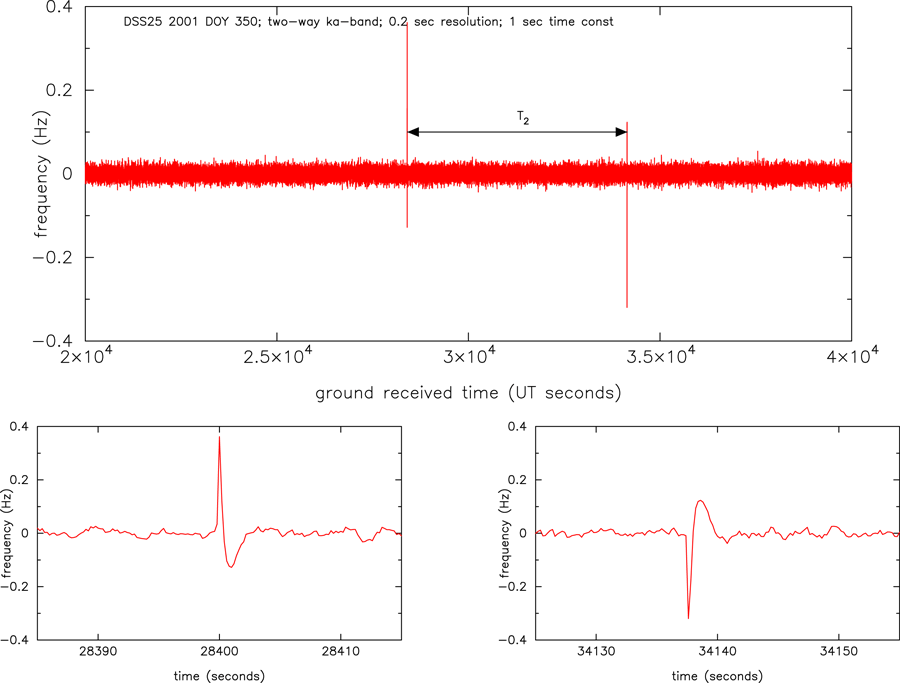
Figure 8: Time series of Cassini two-way Ka-band frequency residuals from a DSS 25 track on
2001 DOY 350. The data are sampled at 0.2 s after being detected with a time constant  1 s.
At this time resolution, the visual appearance of the time series is dominated by high-frequency noise.
Superimposed on this noise are two systematic glitches which were traced to an intermittently-faulty
distribution amplifier in the signal chain providing frequency references to the transmitter and
receiver. The distribution amplifier fault acts like an FTS glitch and, in the two-way Doppler, appears
twice in the time series anticorrelated at the two-way light time (Figure 7). The glitches in the figure
are paired with the indicated two-way light time separation T2
1 s.
At this time resolution, the visual appearance of the time series is dominated by high-frequency noise.
Superimposed on this noise are two systematic glitches which were traced to an intermittently-faulty
distribution amplifier in the signal chain providing frequency references to the transmitter and
receiver. The distribution amplifier fault acts like an FTS glitch and, in the two-way Doppler, appears
twice in the time series anticorrelated at the two-way light time (Figure 7). The glitches in the figure
are paired with the indicated two-way light time separation T2  5737.7 s. The lower panels show
blowups of the pair; the glitch waveforms are unresolved (shapes set by the impulse response of the
software phase detector) but clearly show the characteristic FTS anticorrelation.
5737.7 s. The lower panels show
blowups of the pair; the glitch waveforms are unresolved (shapes set by the impulse response of the
software phase detector) but clearly show the characteristic FTS anticorrelation.
1 s.
At this time resolution, the visual appearance of the time series is dominated by high-frequency noise.
Superimposed on this noise are two systematic glitches which were traced to an intermittently-faulty
distribution amplifier in the signal chain providing frequency references to the transmitter and
receiver. The distribution amplifier fault acts like an FTS glitch and, in the two-way Doppler, appears
twice in the time series anticorrelated at the two-way light time (Figure 7). The glitches in the figure
are paired with the indicated two-way light time separation T2 5737.7 s. The lower panels show
blowups of the pair; the glitch waveforms are unresolved (shapes set by the impulse response of the
software phase detector) but clearly show the characteristic FTS anticorrelation.