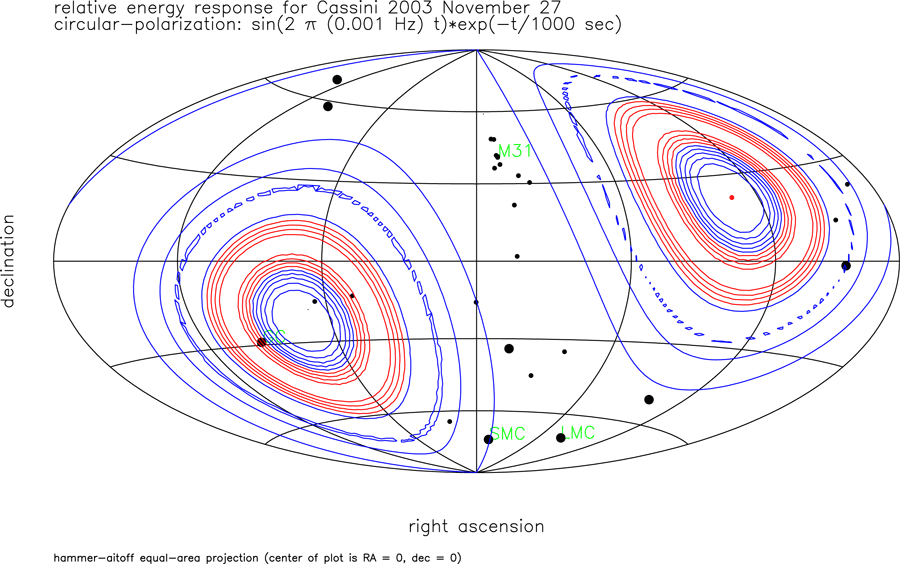
Figure 22: Contours of constant matched filter output for
a wave having  and
and  its Hilbert transform,
adapted from [64]. Cassini November 2003 geometry is assumed (the red dot is the right ascension
and declination of Cassini). Black dots are the positions of members of the Local Group of galaxies.
“GC” marks the location of the galactic center. Contour levels are at 1/10 of the maximum, with
red contours at 0.9 to 0.5 of the maximum signal output and blue contours at 0.4 to 0.1. Doppler
response is zero in the direction of Cassini (and its anti-direction).
its Hilbert transform,
adapted from [64]. Cassini November 2003 geometry is assumed (the red dot is the right ascension
and declination of Cassini). Black dots are the positions of members of the Local Group of galaxies.
“GC” marks the location of the galactic center. Contour levels are at 1/10 of the maximum, with
red contours at 0.9 to 0.5 of the maximum signal output and blue contours at 0.4 to 0.1. Doppler
response is zero in the direction of Cassini (and its anti-direction).
and its Hilbert transform,
adapted from [64]. Cassini November 2003 geometry is assumed (the red dot is the right ascension
and declination of Cassini). Black dots are the positions of members of the Local Group of galaxies.
“GC” marks the location of the galactic center. Contour levels are at 1/10 of the maximum, with
red contours at 0.9 to 0.5 of the maximum signal output and blue contours at 0.4 to 0.1. Doppler
response is zero in the direction of Cassini (and its anti-direction).