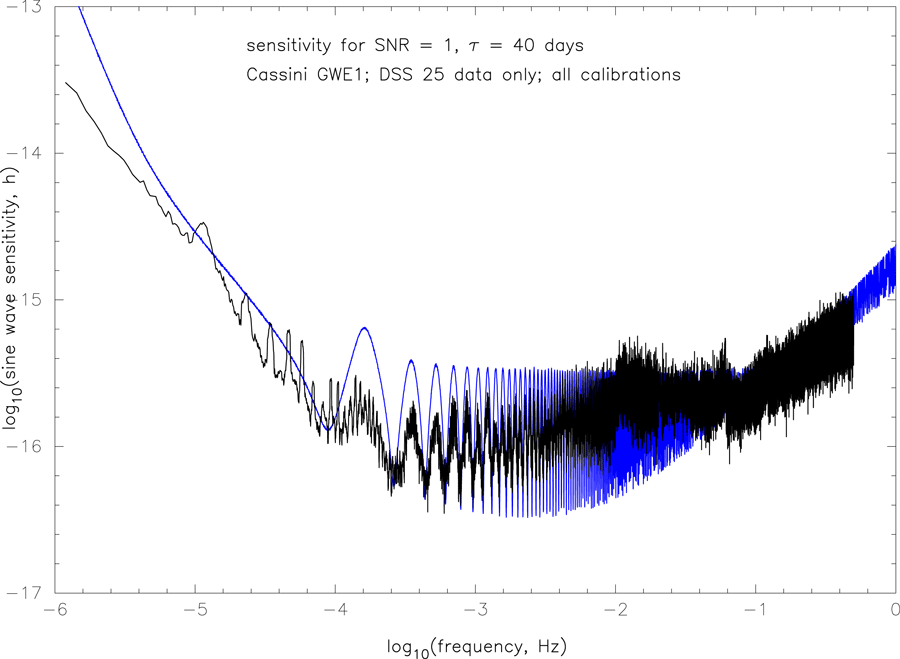
Figure 20: Sensitivity of the Cassini 2001 – 2002 gravitational wave observations, expressed as the
equivalent sinusoidal strain sensitivity required to produce SNR = 1 for a randomly polarized isotropic
background as a function of Fourier frequency. This reflects both the levels, spectral shapes, and
transfer functions of the instrumental noises (see Section 4) and the GW transfer function (see
Section 3). Black curve: sensitivity computed using smoothed version of observed noise spectrum;
blue curve: sensitivity computed from pre-observation predicted noise spectrum [111].