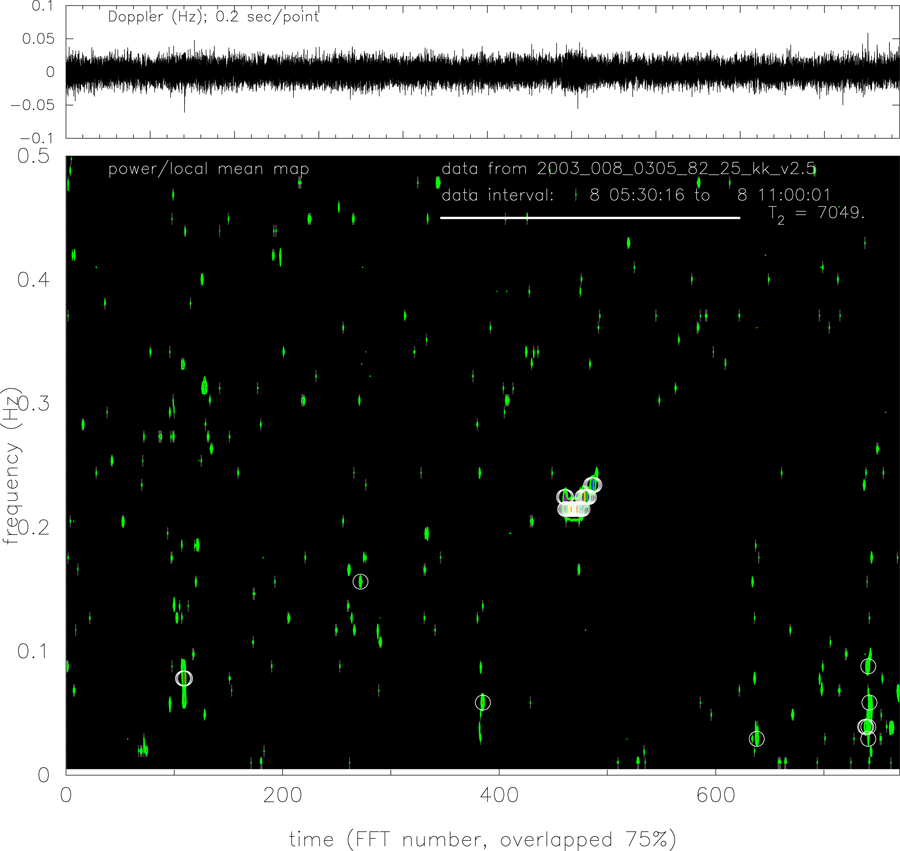
Figure 17: As for Figure 16, but for the Cassini two-way Ka-band track on 2003 DOY 008. The
strong features in the dynamic spectrum at about (08:50, 0.22 Hz) have peak local contrast > 100
(and are even marginally visible in the time series in the upper panel).