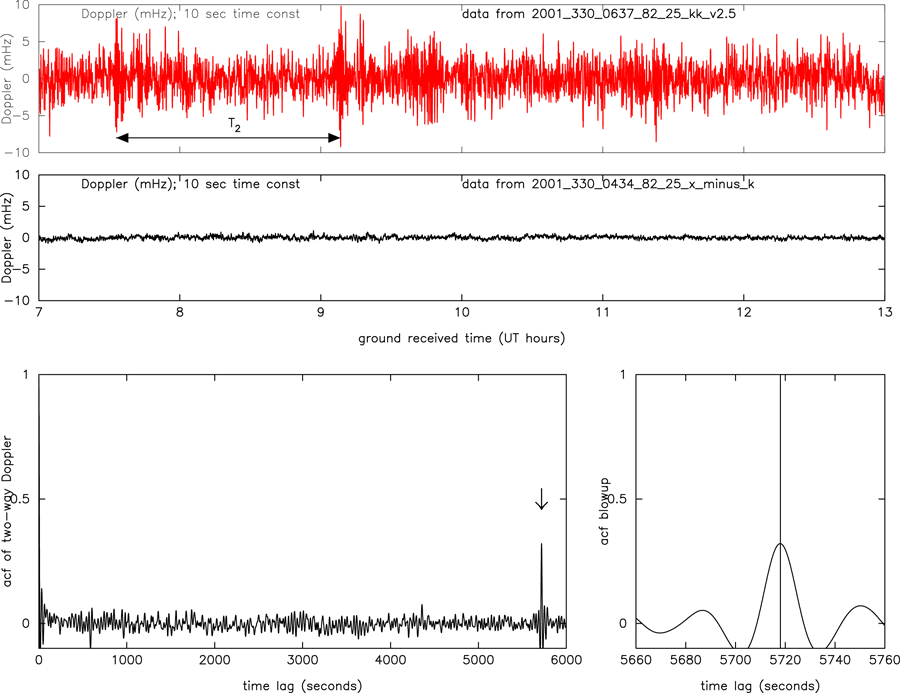
Figure 12: Doppler time series for DSS 25 Cassini track on 2001 DOY 330, showing an antenna
mechanical noise event. Upper panel: time series of the two-way Ka-band, with approximately 10 s
time resolution. The middle panel shows the time series of X-(880/3344) Ka1, i.e., essentially the
X-band plasma on the downlink, indicating the low level of plasma noise on this day. The AMC data
similarly show low tropospheric noise. The event at about 07:30 is echoed about a two-way light time
later, and may be due to gusting wind on this day (another candidate pair is at about 09:45 and a
two-way light time later). The lower left panel shows the autocorrelation of the two-way Ka-band
data, peaking at T2  5717.9 s. The lower right panel is a blow-up of the acf near the lag of a
two-way light time (indicated by the vertical line).
5717.9 s. The lower right panel is a blow-up of the acf near the lag of a
two-way light time (indicated by the vertical line).
5717.9 s. The lower right panel is a blow-up of the acf near the lag of a
two-way light time (indicated by the vertical line).