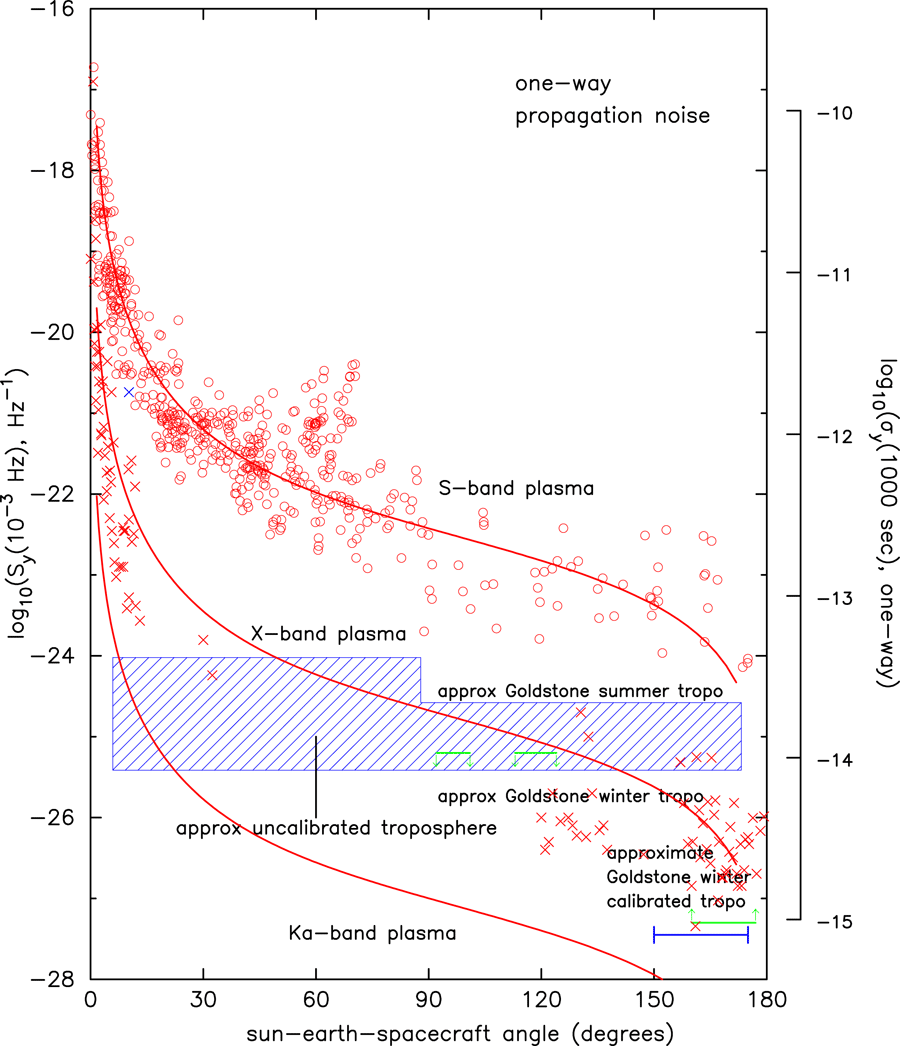
Figure 10: Summary of propagation and antenna mechanical noises as functions of
sun-earth-spacecraft angle (updated from [22], reproduced by permission of the American
Geophysical Union; see also [131, 21, 65, 9, 10, 11, 122, 121]). Left axis: spectral density of
fractional frequency fluctuations at f = 0.001 Hz. Right axis: fractional frequency fluctuation
(Allan deviation  ) at
) at  = 1000 s. S-band
  2.3 GHz; X-band
  8.4 GHz; Ka-band
 32 GHz. Red curves are for plasma scintillation at the indicated radio frequencies (circles are
S-band, more precisely: S-(3/11)X differential frequency fluctuations, data from Viking [131, 21]);
crosses are X-band (more precisely X-(880/3344) Ka1 differential frequency fluctuations, from
Cassini [122, 11, 19, 29, 121]). Blue region shows typical uncalibrated tropospheric scintillation
levels at a moderate-altitude dry site such as Goldstone, CA, or the National Radio Astronomy
Observatory’s Very Large Array [20, 75, 76]. Green arrows show upper (for antennas in the
DSN “high efficiency” sub-network, operated under operational but benign conditions) and
lower (for DSS 25, near solar opposition) limits to antenna mechanical noise [9, 19, 22].
AepubtkUpdateA4Updated Figure 10. BepubtkUpdateB5Replaced Figure 10 with updated version
containing new data.
32 GHz. Red curves are for plasma scintillation at the indicated radio frequencies (circles are
S-band, more precisely: S-(3/11)X differential frequency fluctuations, data from Viking [131, 21]);
crosses are X-band (more precisely X-(880/3344) Ka1 differential frequency fluctuations, from
Cassini [122, 11, 19, 29, 121]). Blue region shows typical uncalibrated tropospheric scintillation
levels at a moderate-altitude dry site such as Goldstone, CA, or the National Radio Astronomy
Observatory’s Very Large Array [20, 75, 76]. Green arrows show upper (for antennas in the
DSN “high efficiency” sub-network, operated under operational but benign conditions) and
lower (for DSS 25, near solar opposition) limits to antenna mechanical noise [9, 19, 22].
AepubtkUpdateA4Updated Figure 10. BepubtkUpdateB5Replaced Figure 10 with updated version
containing new data.
) at = 1000 s. S-band 2.3 GHz; X-band 8.4 GHz; Ka-band
32 GHz. Red curves are for plasma scintillation at the indicated radio frequencies (circles are
S-band, more precisely: S-(3/11)X differential frequency fluctuations, data from Viking [131, 21]);
crosses are X-band (more precisely X-(880/3344) Ka1 differential frequency fluctuations, from
Cassini [122, 11, 19, 29, 121]). Blue region shows typical uncalibrated tropospheric scintillation
levels at a moderate-altitude dry site such as Goldstone, CA, or the National Radio Astronomy
Observatory’s Very Large Array [20, 75, 76]. Green arrows show upper (for antennas in the
DSN “high efficiency” sub-network, operated under operational but benign conditions) and
lower (for DSS 25, near solar opposition) limits to antenna mechanical noise [9, 19, 22].
AepubtkUpdateA4Updated Figure 10. BepubtkUpdateB5Replaced Figure 10 with updated version
containing new data.