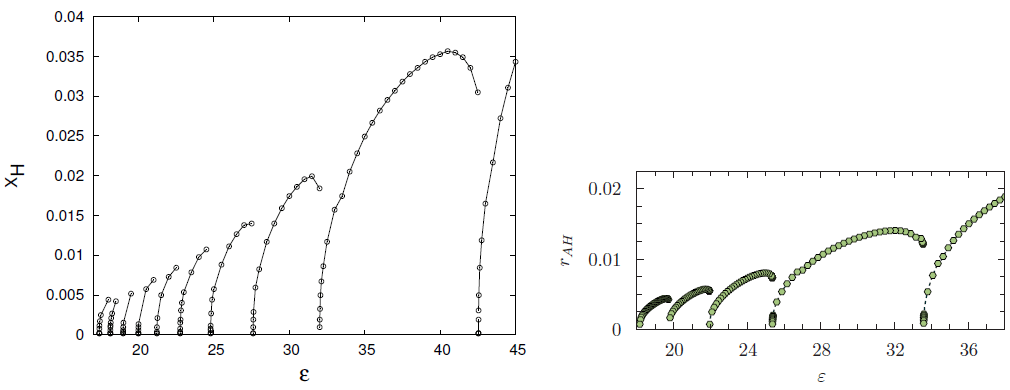
Figure 9: Instability against BH formation in AdS (left panel) and Minkowski enclosed in a
cavity (right panel). In both panels, the horizontal axis represents the amplitude of the initial
(spherically symmetric) scalar field perturbation. The vertical axis represents the size of the BH
formed. Perturbations with the largest plotted amplitude collapse to form a BH. As the amplitude
of the perturbation is decreased so does the size of the BH, which tends to zero at a first threshold
amplitude. Below this energy, no BH is formed in the first generation collapse and the scalar
perturbation scatters towards the boundary. But since the spacetime behaves like a cavity, the scalar
perturbation is reflected off the boundary and re-collapses, forming now a BH during the second
generation collapse. At smaller amplitudes a second, third, etc, threshold amplitudes are found. The
left (right) panel shows ten (five) generations of collapse. Near the threshold amplitudes, critical
behavior is observed. Images reproduced with permission from (left) [108] and from (right) [537],
copyright by APS.
Vitor Cardoso and Leonardo Gualtieri and Carlos Herdeiro and Ulrich Sperhake, "Exploring New Physics Frontiers Through Numerical
Relativity",
Living Rev. Relativity, 18 (2015), 1, doi:10.1007/lrr-2015-1, URL (accessed <date>): http://www.livingreviews.org/lrr-2015-1.![]() This work is licensed under a Creative Commons Attribution 4.0 International License.
© The author(s), except where otherwise noted.
This work is licensed under a Creative Commons Attribution 4.0 International License.
© The author(s), except where otherwise noted.
Living Rev. Relativity, 18 (2015), 1, doi:10.1007/lrr-2015-1, URL (accessed <date>): http://www.livingreviews.org/lrr-2015-1.