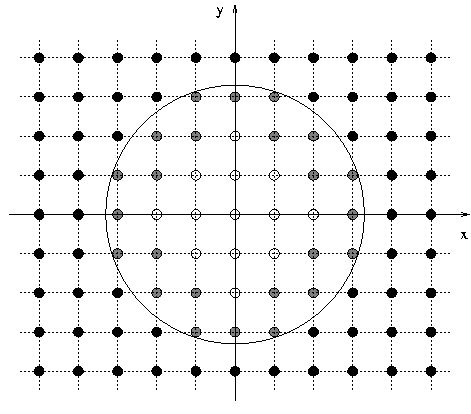
Figure 5: Illustration of singularity excision. The small circles represent vertices of a numerical
grid on a two-dimensional cross section of the computational domain containing the spacetime
singularity, in this case at the origin. A finite region around the singularity but within the event
horizon (large circle) is excluded from the numerical evolution (white circles). Gray circles represent
the excision boundary where function values can be obtained through regular evolution in time using
sideways derivative operators as appropriate (e.g., [630]) or regular update with spectral methods
(e.g., [677, 678]), or through extrapolation (e.g., [703, 723]). The regular evolution of exterior grid
points (black circles) is performed with standard techniques using information also on the excision
boundary.
Vitor Cardoso and Leonardo Gualtieri and Carlos Herdeiro and Ulrich Sperhake, "Exploring New Physics Frontiers Through Numerical
Relativity",
Living Rev. Relativity, 18 (2015), 1, doi:10.1007/lrr-2015-1, URL (accessed <date>): http://www.livingreviews.org/lrr-2015-1.![]() This work is licensed under a Creative Commons Attribution 4.0 International License.
© The author(s), except where otherwise noted.
This work is licensed under a Creative Commons Attribution 4.0 International License.
© The author(s), except where otherwise noted.
Living Rev. Relativity, 18 (2015), 1, doi:10.1007/lrr-2015-1, URL (accessed <date>): http://www.livingreviews.org/lrr-2015-1.