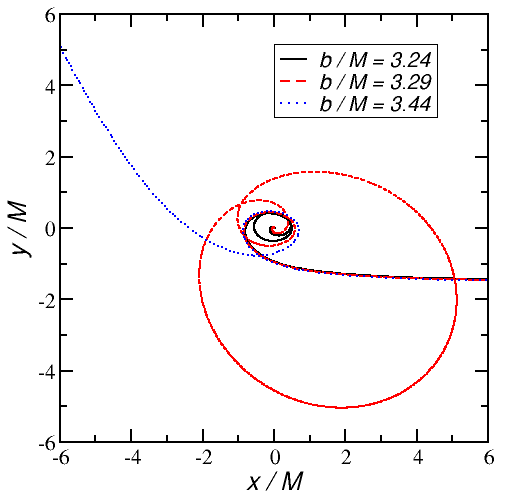
Figure 13: BH trajectories in grazing collisions for  and three values of the impact
parameter corresponding to the regime of prompt merger (solid, black curve), of delayed merger
(dashed, red curve), and scattering (dotted, blue curve). Note that for each case, the trajectory of
one BH is shown only; the other BH’s location is given by symmetry across the origin.
and three values of the impact
parameter corresponding to the regime of prompt merger (solid, black curve), of delayed merger
(dashed, red curve), and scattering (dotted, blue curve). Note that for each case, the trajectory of
one BH is shown only; the other BH’s location is given by symmetry across the origin.Vitor Cardoso and Leonardo Gualtieri and Carlos Herdeiro and Ulrich Sperhake, "Exploring New Physics Frontiers Through Numerical
Relativity",
Living Rev. Relativity, 18 (2015), 1, doi:10.1007/lrr-2015-1, URL (accessed <date>): http://www.livingreviews.org/lrr-2015-1.![]() This work is licensed under a Creative Commons Attribution 4.0 International License.
© The author(s), except where otherwise noted.
This work is licensed under a Creative Commons Attribution 4.0 International License.
© The author(s), except where otherwise noted.
Living Rev. Relativity, 18 (2015), 1, doi:10.1007/lrr-2015-1, URL (accessed <date>): http://www.livingreviews.org/lrr-2015-1.