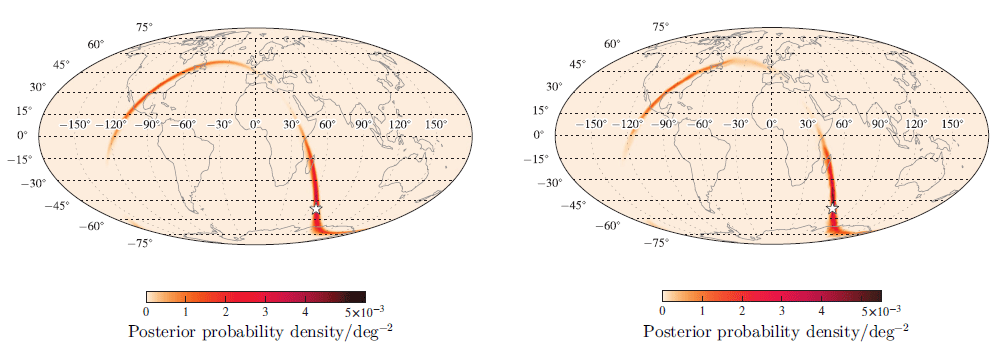
Figure 5: Posterior probability density for sky location for an example binary neutron-star
coalescence observed with a two-detector network. Left: Map produced by the low-latency bayestar
code [99, 98]. Right: Map produced by the higher-latency (non-spinning) LALInference [110],
which also produces posterior estimates for other parameters. These algorithms are discussed
in Section 3.2.1. The star indicates the true source location. The event has a network
signal-to-noise ratio of  using a noise curve appropriate for the first aLIGO run (O1,
see Section 4.1). The plot is a Mollweide projection in geographic coordinates. Image reproduced
with permission from [31], copyright by APS; further mock sky maps for the first two observing
runs can be found at
using a noise curve appropriate for the first aLIGO run (O1,
see Section 4.1). The plot is a Mollweide projection in geographic coordinates. Image reproduced
with permission from [31], copyright by APS; further mock sky maps for the first two observing
runs can be found at  www.ligo.org/scientists/first2years/ for binary neutron-star signals and
www.ligo.org/scientists/burst-first2years/ for burst signals.
www.ligo.org/scientists/first2years/ for binary neutron-star signals and
www.ligo.org/scientists/burst-first2years/ for burst signals.
using a noise curve appropriate for the first aLIGO run (O1,
see Section 4.1). The plot is a Mollweide projection in geographic coordinates. Image reproduced
with permission from [31], copyright by APS; further mock sky maps for the first two observing
runs can be found at www.ligo.org/scientists/first2years/ for binary neutron-star signals and
www.ligo.org/scientists/burst-first2years/ for burst signals.