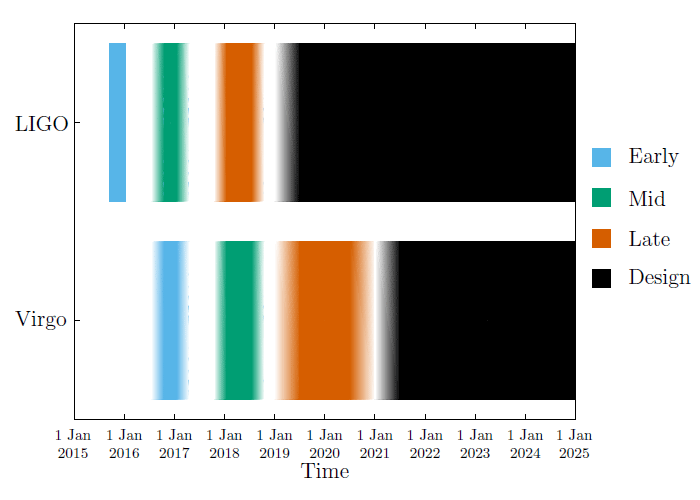
Figure 2: The planned sensitivity evolution and observing runs of the aLIGO and AdV detectors
over the coming years. The colored bars show the observing runs, with the expected sensitivities
given by the data in Figure 1. There is significant uncertainty in the start and end times of the
observing runs, especially for those further in the future, and these could move forward or backwards
by a few months relative to what is shown above. The plan is summarised in Section 2.2.