List of Figures
 |
Figure 1:
Globular cluster distribution about the galaxy. Positions are from Harris [193] and are plotted as black circles on top of the COBE FIRAS 2.2 micron map of the Galaxy using a Mollweide projection. Image reproduced from Brian Chaboyer’s website [69]. |
 |
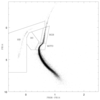
Figure 2:
Colour–magnitude diagram for M80. Image reproduced from the catalogue of 52 globular clusters (see [413]). The entire catalogue is available at the Padova Globular Cluster Group website [166]. |
 |
Figure 3:
CMD for NGC 288 showing evidence of two populations, and models incorporating different metallicities, helium fraction, and age. The best fit model has an age difference of  Age = 1.5 Gyr. Image reproduced by permission from Roh et al. [412], copyright by IOP. Age = 1.5 Gyr. Image reproduced by permission from Roh et al. [412], copyright by IOP. |
 |
Figure 4:
Hubble Space Telescope photograph of the dense globular cluster M80 (NGC 6093). |
 |
Figure 5:
Lagrange radii indicating the evolution of a Plummer model globular cluster for an N-body simulation and a Monte Carlo simulation. The radii correspond to radii containing 0.35, 1, 3.5, 5, 7, 10, 14, 20, 30, 40, 50, 60, 70, and 80% of the total mass. Image reproduced by permission from Joshi et al. [253], copyright by IOP. |
 |
Figure 6:
CMD of NGC 6205 from the Hubble Space Telescope Advanced Detector for Surveys. Different populations are identified as horizontal branch (HB), red giant branch (RGB), main sequence turn off (MSTO), and blue stragglers (BS). Image reproduced by permission from Leigh, Sills, & Knigge [292]. |
 |
Figure 7:
X-ray luminosity functions for several individual galaxies. Each can be fit will with a single power law. Image reproduced by permission from Kim & Fabbiano [258], copyright by IOP. |
 |
Figure 8:
X-ray luminosity function for several galaxies combined together. On the left is the best fit to a single power law, while a broken power law fit is shown in the right. Image reproduced by permission from Kim & Fabbiano [258], copyright by IOP. |
 |
Figure 9:
GC magnitudes (Mz) vs. GC colors (g – z), with integrated histograms of the properties above and to the right. GCs unmatched to LMXBs are indicated by small black dots and open black histograms (scaled down by a factor of 10). Blue GCs with LMXBs are indicated by filled blue squares and histograms. Red GCs with LMXBs are indicated by filled red circles and histograms. The histograms of the GCs with LMXBs are stacked on each other. GCs that are redder and brighter are more likely to contain LMXBs. Image reproduced by permission from Sivakoff et al. [440], copyright by IOP. |
 |
Figure 10:
Cross section of equipotential surfaces in the orbital plane of a binary with q = 0.4. The values of the potential surfaces are 5.0, 3.9075, 3.8, 3.559, 3.2, 3.0, and 2.8. The units have been normalized to the orbital separation, so a = 1. |
 |
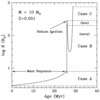
Figure 11:
Evolution of the radius for a  star with a metallicity of Z = 0.001. Image
reproduced by permission from Pfahl et al. [372], copyright by IOP. star with a metallicity of Z = 0.001. Image
reproduced by permission from Pfahl et al. [372], copyright by IOP. |
 |
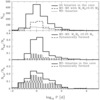
Figure 12:
Binary period distributions from the Monte Carlo simulation of binary fraction evolution in 47 Tuc. The bottom panel indicates the period distribution for binaries containing at least one white dwarf.  is the total number of binaries and is the total number of binaries and  is the number of binaries per bin. Image
reproduced by permission from Ivanova et al. [244]. is the number of binaries per bin. Image
reproduced by permission from Ivanova et al. [244]. |
 |
Figure 13:
Statistical properties of eccentric DWDs (  ) in the LISA band ( ) in the LISA band ( )
for three different cluster models. Hatched histograms are for the entire eccentric DWD population
while shaded histograms arefore the DWDs with at least two harmonics individually resolvable by
LISA with an )
for three different cluster models. Hatched histograms are for the entire eccentric DWD population
while shaded histograms arefore the DWDs with at least two harmonics individually resolvable by
LISA with an  (5 year mission, 10 kpc distance). The PDFs are normalized to unity.
From left to right: frequency, eccentricity, total mass, mass ratio and lifetime before merger. Plot
reproduced by permission from Willems et al. 2007 [487], copyright by IOP. (5 year mission, 10 kpc distance). The PDFs are normalized to unity.
From left to right: frequency, eccentricity, total mass, mass ratio and lifetime before merger. Plot
reproduced by permission from Willems et al. 2007 [487], copyright by IOP. |
 |
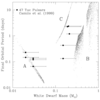
Figure 14:
Results of the Monte Carlo simulation of neutron star–white dwarf binary generation and evolution in 47 Tuc. Each small dot represents a binary system. The circles and error bars are the 10 binary pulsars in 47 Tuc with well measured orbits. Systems in A have evolved through mass transfer from the white dwarf to the neutron star. Systems in B have not yet evolved through gravitational radiation to begin RLOF from the white dwarf to the neutron star. Systems in C will not undergo a common envelope phase. Image reproduced by permission from Rasio et al. [405], copyright by IOP. |
 |
Figure 15:
Contours of constant number of X-ray binaries as a function of the “Verbunt parameters”. Here  , ,  , ,  is the average stellar density, is the average stellar density,  is the core radius and is the core radius and  the core velocity dispersion.
  describes the two-body stellar encounter rate and describes the two-body stellar encounter rate and  describes the
rate of encounters between a single binary with the stellar background. The squares represent the
location of various Galactic globular clusters in the describes the
rate of encounters between a single binary with the stellar background. The squares represent the
location of various Galactic globular clusters in the  plane and the number in parentheses is
the number of X-ray binaries observed in the cluster. Plot reproduced by permission from Banerjee
and Ghosh [30], copyright by IOP. plane and the number in parentheses is
the number of X-ray binaries observed in the cluster. Plot reproduced by permission from Banerjee
and Ghosh [30], copyright by IOP. |
 |
Figure 16:
Total number of black holes ejected in building up to a  IMBH as a function
of seed mass. The four numbered curves are made assuming different cluster escape velocities. The
dotted line is 103 black holes, the assumed population for a young cluster. As can be seen, a very
large seed mass is necessary before IMBH formation by merging black holes becomes a possibility.
Image reproduced by permission from Gültekin et al. [186], copyright by IOP. IMBH as a function
of seed mass. The four numbered curves are made assuming different cluster escape velocities. The
dotted line is 103 black holes, the assumed population for a young cluster. As can be seen, a very
large seed mass is necessary before IMBH formation by merging black holes becomes a possibility.
Image reproduced by permission from Gültekin et al. [186], copyright by IOP. |
 |
Figure 17:
The effect of stellar wind mass-loss on the evolution of a runaway merger product during core hydrogen and core helium burning. The blue curve corresponds to the mass-loss used by Portegies Zwart et al. (2004) [385]. The black curve corresponds to the mass-loss used by Belkus et al. (2007) [49] with Z = 0.02 while the red line is for the same models but Z = 0.001 Image reproduced by permission from Vanbeveren et al. [468], copyright by Springer. |

