 |
|
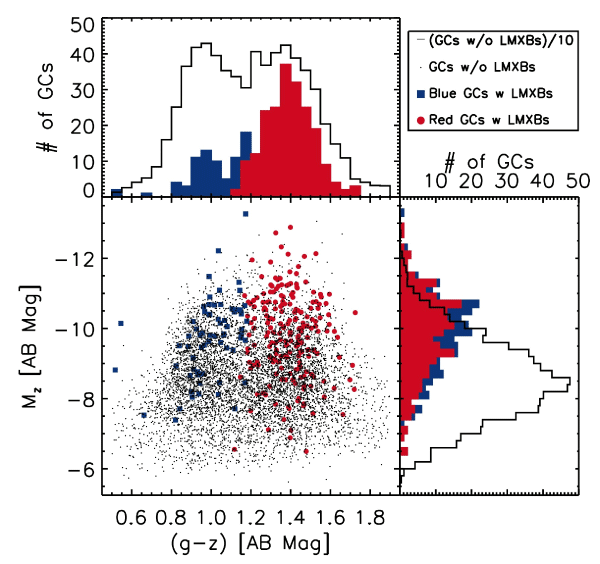
Figure 9: GC magnitudes (Mz) vs. GC colors (g – z), with integrated histograms of the properties
above and to the right. GCs unmatched to LMXBs are indicated by small black dots and open
black histograms (scaled down by a factor of 10). Blue GCs with LMXBs are indicated by filled blue
squares and histograms. Red GCs with LMXBs are indicated by filled red circles and histograms. The
histograms of the GCs with LMXBs are stacked on each other. GCs that are redder and brighter are
more likely to contain LMXBs. Image reproduced by permission from Sivakoff et al. [440], copyright
by IOP.
|
Matthew J. Benacquista and Jonathan M. B. Downing, "Relativistic Binaries in Globular Clusters",
Living Rev. Relativity, 16 (2013), 4, doi:10.12942/lrr-2013-4, URL (accessed <date>): http://www.livingreviews.org/lrr-2013-4. This work is licensed under a Creative Commons License.
© The author(s), except where otherwise noted.
This work is licensed under a Creative Commons License.
© The author(s), except where otherwise noted.
Living Rev. Relativity, 16 (2013), 4, doi:10.12942/lrr-2013-4, URL (accessed <date>): http://www.livingreviews.org/lrr-2013-4.
This work is licensed under a Creative Commons License.
© The author(s), except where otherwise noted.