5.2 Evaluating two-point correlation functions from N-body simulation data
The theoretical modeling described above was tested against simulation results by Hamana, Colombi,
and Suto [28 ]. Using cosmological
  -body simulations in SCDM and
  -CDM models, they generated
light-cone samples as follows: First, they adopt a distance observer approximation and assume that the
line-of-sight direction is parallel to the
-CDM models, they generated
light-cone samples as follows: First, they adopt a distance observer approximation and assume that the
line-of-sight direction is parallel to the  -axis regardless of its
  position. Second,
they periodically duplicate the simulation box along the
position. Second,
they periodically duplicate the simulation box along the  -direction so that at a redshift
 , the position and velocity of those particles locating within an interval
  are
dumped, where
are
dumped, where  is determined by the output time-interval of the original
  -body
simulation. Finally they extract five independent (non-overlapping) cone-shape samples with
the angular radius of 1 degree (the field-of-view of
-body
simulation. Finally they extract five independent (non-overlapping) cone-shape samples with
the angular radius of 1 degree (the field-of-view of  degree
 ). In this manner, they have
generated mock data samples on the light-cone continuously extending up to
). In this manner, they have
generated mock data samples on the light-cone continuously extending up to  (relevant for
galaxy samples) and
(relevant for
galaxy samples) and  (relevant for QSO samples) from the small and large boxes,
respectively.
(relevant for QSO samples) from the small and large boxes,
respectively.
The two-point correlation function is estimated by the conventional pair-count adopting the following
estimator [43]:
The comoving separation  of two objects located at
  and
and  with an angular separation
  is given by
where  and
and  .
.
In redshift space, the observed redshift  for each object differs from the “real” one
  due to
the velocity distortion effect:
due to
the velocity distortion effect:
where  is the line of sight relative peculiar velocity between the object and the observer in
physical units. Then the comoving separation
is the line of sight relative peculiar velocity between the object and the observer in
physical units. Then the comoving separation  of two objects in redshift space is computed as
where
of two objects in redshift space is computed as
where  and
and  .
.
In properly predicting the power spectra on the light-cone, the selection function should be
specified. For galaxies, we adopt a B-band luminosity function of the APM galaxies fitted to the
Schechter function [44]. For quasars, we adopt the B-band luminosity function from the 2dF
QSO survey data [7]. To compute the B-band apparent magnitude from a quasar of absolute
magnitude  at
at  (with the luminosity distance
  ), we applied the K-correction,
for the quasar energy spectrum  (we use
  ). In practice, we adopt the galaxy selection
function
). In practice, we adopt the galaxy selection
function  with
with  and
and  for the small box realizations, and the QSO
selection function
for the small box realizations, and the QSO
selection function  with
with  and
and  for the large box realizations.
We do not introduce the spatial biasing between selected particles and the underlying dark
matter.
for the large box realizations.
We do not introduce the spatial biasing between selected particles and the underlying dark
matter.
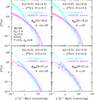
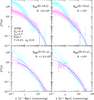
Figures 14 and 15 show the two-point correlation functions in SCDM and  -CDM, respectively,
taking account of the selection functions. It is clear that the simulation results and the predictions are in
good agreement.
-CDM, respectively,
taking account of the selection functions. It is clear that the simulation results and the predictions are in
good agreement.