Madgwick et al. [45![]() ] applied the Principal Component Analysis to compress each galaxy spectrum into one
quantity,
] applied the Principal Component Analysis to compress each galaxy spectrum into one
quantity, ![]() . Qualitatively,
. Qualitatively, ![]() is an indicator of the ratio of the present to the past star
formation activity of each galaxy. This allows one to divide the 2dFGRS into
is an indicator of the ratio of the present to the past star
formation activity of each galaxy. This allows one to divide the 2dFGRS into ![]() -types, and to
study, e.g., luminosity functions and clustering per type. Norberg et al. [61
-types, and to
study, e.g., luminosity functions and clustering per type. Norberg et al. [61![]() ] showed that, at all
luminosities, early-type galaxies have a higher bias than late-type galaxies, and that the biasing
parameter, defined here as the ratio of the galaxy to matter correlation function
] showed that, at all
luminosities, early-type galaxies have a higher bias than late-type galaxies, and that the biasing
parameter, defined here as the ratio of the galaxy to matter correlation function ![]() varies as
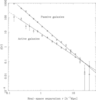
varies as ![]() . Figure 25
. Figure 25![]() indicates that for
indicates that for ![]() galaxies, the real space
correlation function amplitude of
galaxies, the real space
correlation function amplitude of ![]() early-type galaxies is
early-type galaxies is ![]() higher than that of late-type
galaxies.
higher than that of late-type
galaxies.
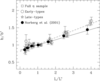
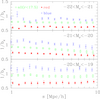
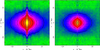
Figure 26![]() shows the redshift-space correlation function in terms of the line-of-sight and perpendicular to
the line-of-sight separation
shows the redshift-space correlation function in terms of the line-of-sight and perpendicular to
the line-of-sight separation ![]() . The correlation function calculated from the most passively (‘red’, for
which the present rate of star formation is less than 10% of its past averaged value) and actively (‘blue’)
star-forming galaxies. The clustering properties of the two samples are clearly distinct on scales
. The correlation function calculated from the most passively (‘red’, for
which the present rate of star formation is less than 10% of its past averaged value) and actively (‘blue’)
star-forming galaxies. The clustering properties of the two samples are clearly distinct on scales
![]() . The ‘red’ galaxies display a prominent finger-of-God effect and also have a higher overall
normalization than the ‘blue’ galaxies. This is a manifestation of the well-known morphology-density
relation. By fitting
. The ‘red’ galaxies display a prominent finger-of-God effect and also have a higher overall
normalization than the ‘blue’ galaxies. This is a manifestation of the well-known morphology-density
relation. By fitting ![]() over the separation range
over the separation range ![]() for each class, it was
found that
for each class, it was
found that ![]() ,
, ![]() and corresponding pairwise velocity
dispersions
and corresponding pairwise velocity
dispersions ![]() of
of ![]() and
and ![]() [45
[45![]() ]. At small separations, the real
space clustering of passive galaxies is stronger than that of active galaxies: The slopes
]. At small separations, the real
space clustering of passive galaxies is stronger than that of active galaxies: The slopes ![]() are
respectively 1.93 and 1.50 (see Figure 27
are
respectively 1.93 and 1.50 (see Figure 27![]() ) and the relative bias between the two classes is a declining
function of separation. On scales larger than
) and the relative bias between the two classes is a declining
function of separation. On scales larger than ![]() the biasing ratio is approaching
unity.
the biasing ratio is approaching
unity.
Another statistic was applied recently by Wild et al. [98] and Conway et al. [12], of a joint counts-in-cells on 2dFGRS galaxies, classified by both color and spectral type. Exact linear bias is ruled out on all scales. The counts are better fitted to a bivariate log-normal distribution. On small scales there is evidence for stochasticity. Further investigation of galaxy formation models is required to understand the origin of the stochasticity.
Zehavi et al. [104![]() ] analyzed the Early Data Release (EDR) sample of the SDSS 30,000 galaxies to explore
the clustering of per luminosity and color. The inferred real-space correlation function is well described by a
single power-law:
] analyzed the Early Data Release (EDR) sample of the SDSS 30,000 galaxies to explore
the clustering of per luminosity and color. The inferred real-space correlation function is well described by a
single power-law: ![]() for
for ![]() .
The galaxy pairwise velocity dispersion is
.
The galaxy pairwise velocity dispersion is ![]() for projected separations
for projected separations
![]() . When divided by color, the red galaxies exhibit a stronger
and steeper real-space correlation function and a higher pairwise velocity dispersion than do
the blue galaxies. In agreement with 2dFGRS there is clear evidence for a scale-independent
luminosity bias at
. When divided by color, the red galaxies exhibit a stronger
and steeper real-space correlation function and a higher pairwise velocity dispersion than do
the blue galaxies. In agreement with 2dFGRS there is clear evidence for a scale-independent
luminosity bias at ![]() . Subsamples with absolute magnitude ranges centered on
. Subsamples with absolute magnitude ranges centered on
![]() ,
,
![]() , and
, and ![]() have real-space correlation functions that are parallel power laws of slope
have real-space correlation functions that are parallel power laws of slope
![]() with correlation lengths of approximately
with correlation lengths of approximately ![]() ,
, ![]() , and
, and ![]() ,
respectively.
,
respectively.
Figures 27![]() and 28
and 28![]() pose an interesting challenge to the theory of galaxy formation, to explain why the
correlation functions per luminosity bins have similar slope, while the slope for early type galaxies is steeper
than for late type.
pose an interesting challenge to the theory of galaxy formation, to explain why the
correlation functions per luminosity bins have similar slope, while the slope for early type galaxies is steeper
than for late type.
Let us move next to the three-point correlation functions (3PCF) of galaxies, which are the lowest-order
unambiguous statistic to characterize non-Gaussianities due to nonlinear gravitational evolution of dark
matter density fields, formation of luminous galaxies, and their subsequent evolution. The determination of
the 3PCF of galaxies was pioneered by Peebles and Groth [70] and Groth and Peebles [27] using the Lick
and Zwicky angular catalogs of galaxies. They found that the 3PCF ![]() obeys the hierarchical
relation:
obeys the hierarchical
relation:
As we have seen in Section 6.3.2, galaxy clustering is sensitive to the intrinsic properties of the galaxy
samples under consideration, including their morphological types, colors, and luminosities. Nevertheless the
previous analyses were not able to examine those dependences of 3PCFs because of the limited
number of galaxies. Indeed Kayo et al. [39![]() ] were the first to perform the detailed analysis of
3PCFs explicitly taking account of the morphology, color, and luminosity dependence. They
constructed volume-limited samples from a subset of the SDSS galaxy redshift data, ‘Large-scale
Structure Sample 12’. Specifically they divided each volume limited sample into color subsamples of
red (blue) galaxies, which consist of 7949 (8329), 8930 (8155), and 3706 (3829) galaxies for
] were the first to perform the detailed analysis of
3PCFs explicitly taking account of the morphology, color, and luminosity dependence. They
constructed volume-limited samples from a subset of the SDSS galaxy redshift data, ‘Large-scale
Structure Sample 12’. Specifically they divided each volume limited sample into color subsamples of
red (blue) galaxies, which consist of 7949 (8329), 8930 (8155), and 3706 (3829) galaxies for
![]() ,
, ![]() , and
, and ![]() ,
respectively.
,
respectively.
Figure 29![]() indicates the dimensionless amplitude of the 3PCFs of SDSS galaxies in redshift space,
indicates the dimensionless amplitude of the 3PCFs of SDSS galaxies in redshift space,
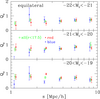
In order to demonstrate the expected dependence in the current samples, they compute the biasing parameters estimated from the 2PCFs,
where the index As an illustrative example, consider a simple bias model in which the galaxy density field ![]() for the
for the
![]() -th population of galaxies is given by
-th population of galaxies is given by
Such behavior is unlikely to be explained by any simple model inspired by the perturbative expansion
like Equation (176![]() ). Rather it indeed points to a kind of regularity or universality of the clustering
hierarchy behind galaxy formation and evolution processes. Thus the galaxy biasing seems much more
complex than the simple deterministic and linear model. More precise measurements of 3PCFs and even
higher-order statistics with future SDSS datasets would be indeed valuable to gain more specific insights
into the empirical biasing model.
). Rather it indeed points to a kind of regularity or universality of the clustering
hierarchy behind galaxy formation and evolution processes. Thus the galaxy biasing seems much more
complex than the simple deterministic and linear model. More precise measurements of 3PCFs and even
higher-order statistics with future SDSS datasets would be indeed valuable to gain more specific insights
into the empirical biasing model.
| http://www.livingreviews.org/lrr-2004-8 |
© Max Planck Society and the author(s)
Problems/comments to |